Profiling
Overview
Estimating job resources is important but tricky. Too much and job will wait longer in queue; too little and job will hit limits and be terminated. The solution to this problem is job profiling - measure and analyse how much CPU, memory and time your job actually uses. When you submit jobs on our cluster, a profiler automatically runs in background, putting statistics into the Slurm output log. In addition to CPU and memory usage, our profiler also reports data read & write which can help optimise and debug your jobs.
reportseff
Utility reportseff provides overview of how efficiently your Slurm jobs use the requested resources.
reportseff is highly configurable so here are some common scenarios:
- Print my jobs for last week:
$ reportseff -u `whoami` --since 'd=7'
  JobID     State     Elapsed    CPUEff    MemEff
xxxxxxx    FAILED    00:05:27    36.3%     13.5%
xxxxxxx   TIMEOUT    00:10:17    12.7%      0.0%
xxxxxxx  COMPLETED   00:11:43     5.2%     16.6%
...
CPUEff is your average CPU efficiency, MemEff is your maximum memory efficiency.
This is because the underlying Slurm metrics are average CPU and maximum memory.
-
Remind yourself what they requested, and right-align new columns:
$ reportseff -u `whoami` --format="+NCPUs%>,ReqMem%>" JobID State Elapsed CPUEff MemEff NCPUS ReqMem xxxxxxx FAILED 00:05:27 36.3% 13.5% 8 50G xxxxxxx TIMEOUT 00:10:17 12.7% 0.0% 8 50G xxxxxxx COMPLETED 00:11:43 5.2% 16.6% 20 200G ... -
Print my jobs named "rstudio":
reportseff -u `whoami` --extra-args "--name=rstudio" -
Exclude cancelled jobs:
reportseff -u `whoami` -S CANCELLED -
Jobs that exceeded time/memory:
reportseff -u `whoami` -s TIMEOUT,OUT_OF_MEMORY -
Show a specific job:
reportseff $JOBID -
Show a job array:
reportseff $BASEIDJobID State Elapsed TimeEff CPUEff MemEff BASEID_1 FAILED 00:13:51 0.2% 10.1% 0.4% BASEID_2 FAILED 00:16:19 0.2% 10.1% 0.4% ... -
Analyse job ouputs in current folder:
reportseff
Job charts
How many CPUs do I need?
The first profiler chart you will see in output log is CPU usage. Below is example usage for a STAR job that requested 8 CPUs:
                                   CPU (cores)
  8 +-----------------------------------------------------------------------+
    |      +      +       +      +      +      +      +       +      +      |
    |                                                                       |
  7 |-+                                                                   +-|
    |                       # ####                                          |
  6 |-+                ##### #    ##                                      +-|
    |             # ####            ##                                      |
    |           ####                  ####                                  |
  5 |-+        ##                        ####                             +-|
    |        ##                             #####                           |
    |        #                                   #####                      |
  4 |-+     #                                         ######              +-|
    |      #                                               ##########       |
    |     #                                                          ##     |
  3 |-+   #                                                           #   +-|
    |     #                                                           #     |
  2 |-+  #                                                            #   +-|
    |    #                                                            #     |
    |   #                                                              #    |
  1 |-+ #                                                              #  +-|
    |####                                                              #    |
    |#     +      +       +      +      +      +      +       +      + #    |
  0 +-----------------------------------------------------------------------+
    0      10     20      30     40     50     60     70      80     90    100
                               Job profiling step
This is a simple graph of total aggregated CPU use over time, showing STAR CPU use was not optimal. High CPU utilisation was achieved for just 10% of job time, and 4 CPUs were idle for almost half the job time. It would not be appropriate to allocate even more CPUs to this job. A good starting point for your CPU estimate is: documentation recommendation, or 4 CPUs if job certainly parallel, else 1 CPU. If unsure then less is better - it allows higher jobs throughput, and is considerate to other cluster users. It's also important that you expliticly instruct your software to use the requested number of CPUs, it may be defaulting to 1 CPU.
Advanced tip: If your CPU profile has significant idle gaps, consider whether you can split you job up into stages that each request appropriate number of CPUs.
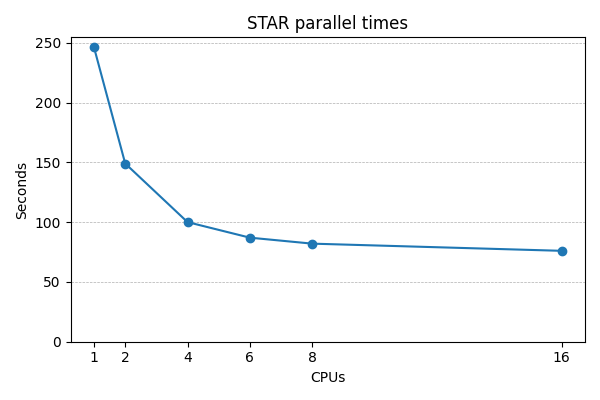
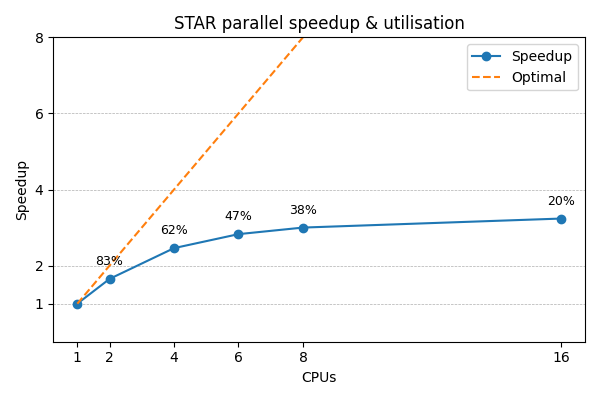
For a rigorous numerical approach, you should stop adding more CPUs when the extra speedup is significantly less than the extra CPUs. E.g. if doubling the CPUs, then ideally STAR will complete in half the time - a 2x speedup. But real speedup is usually less, and when it is significantly less then stop adding more CPUs. Below shows this STAR job stops improving beyond 4-6 CPUs, so requesting more CPUs just reduces utilisation.
How much memory do I need?
The next profiler chart shows memory usage, where job requested 10GB:
                                   Memory (GB)
  10 +----------------------------------------------------------------------+
     |      +      +      +      +       +      +      +      +      +      |
   9 |-+                                                                  +-|
     |                                                                      |
     |                                                                      |
   8 |-+                                           #                      +-|
     |                                          ### ###################     |
   7 |-+                                       ##                     #   +-|
     |                                         #                      #     |
   6 |-+                                     ##                       #   +-|
     |                                      ##                        #     |
   5 |-+                                   #                          #   +-|
     |                                    ##                          #     |
     |                                    #                           #     |
   4 |-+                                 #                            #   +-|
     |                                   #                            #     |
   3 |-+         #########################                            #   +-|
     |        ###                        #                            #     |
   2 |-+      #                          #                            #   +-|
     |       #                                                        #     |
     |     ##                                                         #     |
   1 |-+  ##                                                           #  +-|
     |  ##  +      +      +      +       +      +      +      +      + #    |
   0 +----------------------------------------------------------------------+
     0      10     20     30     40      50     60     70     80     90    100
                               Job profiling step
Memory consumption is largely determined by input data size and STAR algorithm, so nothing we can do to improve the underuse of memory in first half of job. All we can do is minimise the amount of memory that is never used.
Estimating memory requirements is best done with one conservative job, either estimating memory use as a small multiple of input file size e.g. 2x, or submit with a short time limit e.g. 1 hour. Please don't submit multiple jobs while you are unsure how much memory is needed, as this can waste significant resources. Once you have a figure for how much memory to use, add a small amount of headroom. 25% - 50% is likely to be sufficient, so don't overdo it! Remember it is easy to increase again and re-run jobs.
Advanced tips: Memory is in high demand; if you can run more jobs with each using less memory this may be worth doing. Also, if you can split a single job with varying memory requirements into multiple, more predictable jobs, you can run more jobs at once.
Disk usage information
Finally, we get two graphs for disk usage:
                                   Data read (GB)
   0.04 +-------------------------------------------------------------------+
        |         +        +         +       ###############################|
        |                                    #                              |
  0.035 |-+                                  #                            +-|
        |                                    #                              |
        |                                    #                              |
   0.03 |-+                                 #                             +-|
        |                                   #                               |
        |                                   #                               |
  0.025 |-+                                 #                             +-|
        |####################################                               |
   0.02 |#+                                                               +-|
        |#                                                                  |
        |#                                                                  |
  0.015 |#+                                                               +-|
        |#                                                                  |
        |#                                                                  |
   0.01 |-+                                                               +-|
        |                                                                   |
        |                                                                   |
  0.005 |-+                                                               +-|
        |                                                                   |
        |         +        +         +         +         +        +         |
      0 +-------------------------------------------------------------------+
        0         10       20        30        40        50       60        70
                                 Job profiling step
                                Data written (GB)
  6 +-----------------------------------------------------------------------+
    |        +        +        +        +        +        +        +     #  |
    |                                                                 ###   |
    |                                                   ##############      |
  5 |-+                            #####################                  +-|
    |                             #                                         |
    |                           ##                                          |
    |                          #                                            |
  4 |-+                      ##                                           +-|
    |                      ##                                               |
    |                      #                                                |
  3 |-+                  ##                                               +-|
    |                   #                                                   |
    |                 ##                                                    |
    |                #                                                      |
  2 |-+            ##                                                     +-|
    |             #                                                         |
    |            #                                                          |
    |          ##                                                           |
  1 |-+       #                                                           +-|
    |        #                                                              |
    |       #                                                               |
    |     ## +        +        +        +        +        +        +        |
  0 +-----------------------------------------------------------------------+
    0        10       20       30       40       50       60       70       80
                               Job profiling step
In general you won't necessarily need these. However, as you get more proficient with Slurm and particularly as you start to optimse and troubleshoot your jobs, this may become useful.
The profiling tar.gz archive
Every Slurm job is accompanied by a tar.gz archive which contains lots of useful profiling resources.
In the same way that Slurm automatically generates a log file,
we automatically generate profiling data for every job.
While this cannot be disabled, you are free to delete it but note this will
interfere with our assistance in job execution problems.
The archive can be extracted using tar, and inside you'll find:
| File | Purpose |
|---|---|
| sps-JOBID.log | A log file containing overview information about the profiling process |
| sps-JOBID-[cpu|mem|read|write].tsv | Raw per-process profiling data that you can re-analyse at any time |
| sps-JOBID-[cpu|mem|read|write].tsv.ascii | ASCII plots of the full per-process profiling data |
| sps-JOBID-[cpu|mem|read|write].tsv.png | PNG graphical plots of the full per-process profiling data; this can be very useful |
| sps-JOBID-[cpu|mem|read|write].tsv.sum | Raw summarised profiling data that you can re-analyse at any time |
| sps-JOBID-[cpu|mem|read|write].tsv.sum.ascii | ASCII plots of the summarised profiling data; these are the plots which appear in the Slurm log file |
| sps-JOBID-[cpu|mem|read|write].tsv.sum.png | PNG graphical plots of the summarised profiling data |
It's worth spending time reviewing these occassionally as they can be very informative, particularly the full per-process PNG plots.